Ads

Ads

HF Social

Monday, 27 March 2017

Trading Plan: From Formulation to Implementation


Like us on Facebook at Compass Trading Association
And join our group for weekly trading info Compass Trading Association

Lets say you have been working on a trading plan and you finally have a workable one put together. The next step is to put your market strategy to a test on historical data to see how it would perform under certain conditions. The aim is to ensure that your strategy can perform profitably so you can go ahead and use it on a live market. This article will take you through the steps from formulating your plan you implementing it live.


Formulating the plan

First up is actually getting the plan put together and ensure that it is workable and doesn't take over your entire life. So, you will want to look into a few things such as;

  • Your trading goal
This will set out a SMART goal that you wish to accomplish from trading. SMART is an acronym for the guideline of setting goals. Your goal must be Specific, Measurable, Attainable, Realistic and Timebound. Your goal will be the steering for your strategy.
  • Timeframes you want to trade
It will be extremely time consuming and somewhat chaotic if you attempt to trade on all timeframes. As such it is advisable to use at most 3 time frames when trading. One high time frame such as daily or weekly to indicate you the overall trend, One lower one such as 30 mins to give you and entry signal and the other one will be your main timeframe such as the one hour time frame. depending on your strategy you can use just one timeframe.
  • Trading Strategy
Your strategy will involve your trading instruments whether currencies only or currencies and commodities or whatever you choose to trade. It will also outline your entry and exit rules, your pre and post-market routines, what you will do during volatile economic events and also what your trading week will be. It will also involve your money management rules and risk management.
  • Behavioural Rules

Your behavioural rules will include certain controls that limit your emotional trading, revenge trading and anything that will take you away from following your strategy.

How to test the strategy

Testing a strategy might take some work and time if you attempt to do it manually. There are softwares available that can help in testing your strategy on historical data. The testing technique is called Backtesting. It is accomplished by reconstructing, with historical data, trades that would have occurred in the past using rules defined by a given strategy. The result offers statistics that can be used to gauge the effectiveness of the strategy. Using this data, traders can optimize and improve their strategies, find any technical or theoretical flaws, and gain confidence in their strategy before applying it to the real markets. The underlying theory is that any strategy that worked well in the past is likely to work well in the future, and conversely, any strategy that performed poorly in the past is likely to perform poorly in the future.

Read more on Backtesting


Is the Strategy successful

A strategy is considered successful when is at or above a 75% success rate. This can be determined when you backtest your strategy. After testing the strategy and seeing its success rate if it doesn't meet the benchmark then you should look at the test results and see what tweaks can be made to get it to higher success levels. Once a high success rate is achieved then you can go ahead can implement it on the live market.

Like us on Facebook at Compass Trading Association
And join our group for weekly trading info Compass Trading Association

Wednesday, 22 March 2017

Market Influencers and their Impact Part 2


The other major currency up for discussion is the British Pound. The currency is the strongest in the world based on trading prices although USD is the most widely used. It is stronger than the Euro and the USD which makes it something to look at during your trading. The London trading session overlaps the New York session by approximately four hours. Within this time period there is normally a huge amount of volatility which is welcomed by many traders but can blow away others. Below we will focus on some of the key economic events that might trigger the Pound to behave erratically. Keep in mind that the following events are only a few that happens and as such you should always check your economic calendar before trading. A good one can be found at Investing.com.

Bank of England


Mark Carney the current and 120th Governor of the Bank of England is a Canadian with huge powers over monetary policies as he is also the chairman of the Monetary Policy Committee. He has a major role in guiding national economic and monetary policy and is therefore one of the most important public officials in the United Kingdom.

Mr. Carney is the UK's equivalent to the USA's Janet Yellen which his speeches are watched carefully by traders over  the world as they carry much weight on the GBP. His speeches can cause almost immediate reactions and send the currency either spiraling out of control or climbing way out expected range.

Manufacturing Purchasing Manager's Index


If a country doesn't produce then it is dependent on imports which drives the currency down and inflation up. Manufacturing is a key indicator to the health of a country's economy. UK is a major manufacturing country and each months the previous month's data is released. The Manufacturing Purchasing Managers' Index (PMI) measures the activity level of purchasing managers in the manufacturing sector. A reading above 50 indicates expansion in the sector; below 50 indicates contraction. Traders watch these surveys closely as purchasing managers usually have early access to data about their company’s performance, which can be a leading indicator of overall economic performance.

A higher than expected reading should be taken as positive/bullish for the GBP, while a lower than expected reading should be taken as negative/bearish for the GBP.

Prime Minister


Theresa Mary May is the Prime Minister of the United Kingdom and Leader of the Conservative Party, having served as both since July 2016. She has been the Member of Parliament for Maidenhead since 1997. She assumed office on 13 July 2016, following the resignation of David Cameron. She is the first female prime minister since Margaret Thatcher.

Similarly to the president of the USA, the Prime Minister of the UK has a great influence over the direction of the Pound Sterling. Her speeches normally have traders listening keenly to her addresses and any inclination of something that might be taken as a negative impact on the economy will send the pound down while anything positive will send it up.

Gross Domestic Product


Gross Domestic Product (GDP) measures the annualized change in the inflation-adjusted value of all goods and services produced by the economy. It is the broadest measure of economic activity and the primary indicator of the economy's health.

A higher than expected reading should be taken as positive/bullish for the GBP, while a lower than expected reading should be taken as negative/bearish for the GBP.

Like us on Facebook at Compass Trading Association
And join our group for weekly trading info Compass Trading Association

Tuesday, 7 March 2017

Market Influencers and their Impact Part 1

The market is impacted by multiple influences on a day to day basis. These influences either have a negative or positive impact on the currencies that are traded which will determine what happens to your account balance. This is why it is always advisable to check an economic calendar each day before you start trading. There may be high impact events happening throughout the day or week that will definitely give a different perspective when you start trading. In this weeks blog we will look at the USA and some of its market affecting events.
Investing.com is used as an economic calendar source. You can check it out too. Keep in mind that the items below are only a few of the events that affects the market. There a lot more events either of the same impact level or lower.


President


First up is the POTUS himself, whoever it is that is in office has the power to cause huge market swings in an instant. This happens when the president makes public speeches or sign some agreement with a foreign nation. The president will speak on anything from nation building steps to policy development and when he does the public listens and responds. If the president's address is seen as good by the market then it responds accordingly and most likely the USD will gain, fast and huge, against all other currencies. Conversely if the president's address forecast gloom the greenback will fall against its counterparts.

As for trading when the president will speak, it is a high risk moment and most decide to close all trades at such points in time as they aren't sure which impact it will have on the market. Generally after the president's impact is felt by the currency, the market normally calms down and gets back into rhythm. It's best practice to not trade this event as it can wipe out your account if it goes against you. If you trade it always ensure you have proper risk management in place.

Feds


The Federal Reserve also called the Feds (Not the FBI) control interest rate hikes. The current Chairperson for the Fed is Jannet Yellen(February 2014 - February 2018) and as such makes her have more influence over the USD than any other person including the the president. Whenever she speaks the world listens and responds accordingly.

Her comments normally cause short term spikes with positive or negative effect in the market. She has an important address coming up this month(March) where she will address interest rates. Keep an eye out for this while you trade. All of her speeches are broadcasted for the world to see so when the market responds so will your account balance.

NFP


NFP or non-farm payroll is stats on the earnings of the population that is not in the farming sector. This helps to tell the health of the economy and the working class. It measures the change in the number of people employed during the previous month, excluding the farming industry. Job creation is the foremost indicator of consumer spending, which accounts for the majority of economic activity.Better than expected numbers means that people are earning more while the opposite means earnings are down.
This event is an extremely high impact one as seen from previous market impact. When the number come out higher than expected it normally gives the greenback a boost and market sentiments increase with the dollar trending up against its counterparts. When it comes lower than expected the market responds accordingly and trends down. Be careful when trading while this event is occurring. Ensure that risk management is considered or stay away from trading for that time if you are unsure what will happen.

Oil Reserve


WTI (West Texas Intermediate) and Brent Oil as well as world oil prices is normally affected by this event. The USA stockpile's oil in their inventory and a particular amount is expected, normally recorded in millions of barrels. If the US stockpile is higher than expected then oil prices drop globally. This event is just one indicator of world oil prices but it is a huge determinant for WTI and Brent oil that is being traded on the New York Mercantile Exchange (NYMEX).

This indicator also affects the USD whenever it happens as higher than expected oil reserve cause a drop for the USD against its currency counterparts while lower than expected may see a rise in the USD as people try to buy more oil. Oil is traded in USD and as markets buy more oil then more USD is needed in the market place so the demand increase and so does its value.


PMI

The Institute of Supply Management (ISM) Non-Manufacturing Purchasing Managers' Index (PMI) (also known as the ISM Services PMI) report on Business, a composite index is calculated as an indicator of the overall economic condition for the non-manufacturing sector. The NMI is a composite index based on the diffusion indexes for four of the indicators with equal weights: Business Activity (seasonally adjusted), New Orders (seasonally adjusted), Employment (seasonally adjusted) and Supplier Deliveries. 

A reading above 50 percent indicates the non-manufacturing sector economy is generally expanding; below 50 percent indicates the non-manufacturing sector is generally contracting. The Non-Manufacturing ISM Report on Business is based on data compiled from monthly replies to questions asked of more than 370 purchasing and supply executives in over 62 different industries representing nine divisions from the Standard Industrial Classification (SIC) categories. Membership of the Business Survey Committee is diversified by SIC category and is based on each industry contribution to Gross Domestic Product (GDP). 

A higher than expected reading should be taken as positive/bullish for the USD, while a lower than expected reading should be taken as negative/bearish for the USD.


Like us on Facebook at Compass Trading Association
And join our group for weekly trading info Compass Trading Association


Tuesday, 21 February 2017

My live PAMM account report

Hotforex Pamm V2

SO I decided to open a PAMM account to put it to the test over a 3 month period. This is aimed putting the system to the test and following up with updates to let you know how its progressing. To find out more about how PAMM works click on either of the links below and read before getting started:


Starting off with a small investment so as to limit loss I invested with an account manager that has a 5% success fee, 30 days investment time period and 5%penalty for early withdrawal. The aim is to test the system fully and also become a PAMM account manager eventually.

At the end of January the account had depreciated but not very badly. It went down about 6%. This should be expected as it is Forex and you can actually lose some or all of your funds. On the other hand worry wasn't in the equation as the consequences and risk were considered and research conducted on the fund manager to be invested in. The fund manager profile shown a lot potential and the P/L numbers were good. Draw down was not bad either and overall winners versus losers were excellent with winners seeing a huge portion of the stats.

Its now the nearing the end of February and the account balance has now gone back up above what was deposited and seems to be climbing more and more. Currently seeing a 4.48% growth on the initial capital. There will be more updates in another month so remember to check back then to see how everything is going. If you're willing to take this journey also you can do so by clicking the link below or the image above to create and account and get started.


Like us on Facebook at Compass Trading Association
And join our group for weekly trading info Compass Trading Association

Friday, 10 February 2017

High Probability trades


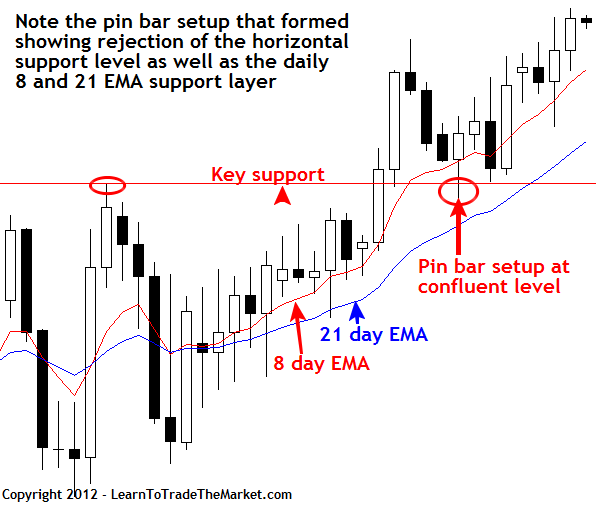
High profitability traders only take trades that have a high probability of working in their favour. Hence having consistent high profits from the market. High probability trades have a particular make up that should always be followed when trading. Support and Resistance or Supply and Demand is the major indicators used by high profit traders. Trend following is next in line as the trend should always be your friend. Traders who follow the trend and know its reversal points are always consistently profitable. Pattern and technical traders use specific rules to ensure that they enter and exit the trend at the right time. All Trades should be taken with confluence and explicit evidence of what is going on in the trade.

Support and Resistance


In technical analysis, support and resistance is a concept that the movement of the price of a security, will tend to stop and reverse at certain predetermined price levels. These levels are denoted by multiple touches of price without a breakthrough of the level.
A support is a zone which the price of a pair tend to have difficulty falling below it while Resistance is a zone where the exchange rate has difficulty breaking above. Most of the times these levels will hold true and price will bounce up from a support level and fall from a resistance level.
Traders normally keep an eye out for these levels as they, in confluence with other markers, provide high probability trade entry points. There are times when price breakout of some of these levels so it is always advisable to look for confirmation before entering a trade. Some traders use indicators to confirm their trade while others use price action and seek bullish evidence at a support level to see if price will bounce and also bearish evidence at a resistance level to see if price will fall.

Trend


"The trend is always your friend' is a common but absolutely accurate term that is used in trading whether Forex, stocks or futures. Following a trend can lead to huge profits and a mega boost to your trading account. Hence it is always good to know what kind of trending is taking place, when to get in the trend and obviously when the trend ends so you can collect your profits and exit the trade.
Therefore high probability trades take into account trading with the trend and following it until it ends. Your trading strategy needs to identify trends and the best entry and exit points.
There are different types of trends and it is always good to know which one you're in at the moment so most of your trades will take place in that general direction. A good way to look at the trend is to go on a time frame such as daily, weekly or monthly to see what's been happening in the market for that entity. Some traders use resistance and support regions to identify entry and exit points, others use patterns to spot reversals or continuations, while other traders use indicators and fundamentals to follow their trade. The key is always to incorporate the trend in your trading strategy so as to increase your profitability.

Confluence


Confluence by definition is;
noun
  1. A flowing together of two or more streams, rivers, or the like.
  2. Their place of junction.
  3. A body of water formed by the flowing together of two or more streams, rivers, or the like.
  4. A coming together of people or things; concourse.
  5. A crowd or throng; assemblage.
Therefore in forex trading it is when multiple indicators, signals or price action story is indicating the same thing. So for example you are using a slow and a fast moving average, the MACD and Resistance and Support levels. Then price reaches a support level and is bouncing off of it, the fast moving average is crossing above the slow one and the MACD is moving above the zero. All these factors is an indication that or has a high probability that the price will go up. Here we say you are trading with confluence since multiple indicators are saying the same thing. Trading this way gives high profit trades.
On the other hand although trades executed with confluence produces high profit trades, waiting for too much things to come together may provide limited amount of signals. Therefore there needs to be an optimal amount of things to wait on to come together to give a signal otherwise you might be waiting for an extremely long time to get one trade.

News impact


Trading news impact can be costly as it can be profitable. The news can cause much volatility which can lead to trades stopping prematurely or getting maximum profit. Therefore you should always check to verify what is happening in the news before you start trading. Most traders make it a part of their pre-trade routine to check the economic calendar for high volatility news events. As a trader I rarely trade news events as most of them cannot be accurately predicted and the market normally responds in a reactive way to news be it negative positive or what was forecasted.


Like us on Facebook at Compass Trading Association
And join our group for weekly trading info Compass Trading Association

Wednesday, 4 January 2017

Live Trading: Don't get steamrolled


Lets say you have been demo trading for a couple months and you strongly believe that you are ready to go live and risk your own money. However, when you start live trading everything seems to be going different from demo trading. How do you avoid this? How do you ensure that you don't get steamrolled by live market volatility? How do you suppress your emotions so you can trade successfully?

There is a set of principles to follow to ensure your success. Continue reading to find out more.

Risk Management


The art of managing your money so you gain maximum returns while minimizing your loss. This statement encompasses the essence of what risk management is all about. It is recommended and should be taken as a principle of trading that you don't risk more than 1% of your trading account on any one trade. This will ensure that you don't lose more than you can afford to. Also ONLY enter trades that gives a risk to reward ratio of 1:3 or better, that means each and every trade that you enter in the event you win it should be three times as much if you had lost that trade. For example, if you enter a trade and based on your entry triggers your stop loss is placed where the possibility exist that you will lose $100 then your take profit should be at a point where you will win $300.

Risk management can be a tedious process but should always be done and ensure that you follow the principles:
1. Never trade more than 1% of your account on anyone trade
2. Always ensure risk to reward radio is always 1:3 or better

Trading Plan


This is where you outline all the steps you will take to complete a trade. The steps will involve
1. When to enter the trade
2. Why you will enter the trade
3. When you will exit the trade
4. Why you will exit the trade
5. How many trades you will make for each trading day
6. When will be your trading days (Look at it as a business and as such your business will need closing and opening hours)
7. How much you will put on each trade (Remember risk-to-reward ratio mentioned above)

Your trading plan should always be followed but it can be tweaked if any points for improvement are found while trading. You can consider your trading plan to be a good one when its success rate is 65% or higher. Having a trading plan is a key principle in trading and should always be adhered to otherwise the consequences can be costly.

Keep a trading journal as part of your trading to ensure that you can revisit your trades and analyze them to find out where any adjustments to your trading strategy is needed.

Emotional Control


No one wants to lose their money, however, trading is extremely risky and more often than not traders lose. The aim is to always keep your emotions in check to ensure that you don't worry too much about losing and focus more and executing the plan.

Demo trading helps you to tweak and refine your trading plan but not necessarily to control the trade emotions. You can pretend that your trading your own money but it isn't quite the same. the real emotions kick in when you put your hard-earned money on the line. the fear losing kicks in and you start to make extremely high risk trades. the key in curbing this is to always stick to your trading plan no matter what. you will lose some trades which is expected but sticking to the plan means your overall statistics will show better.

It's always advised to keep emotions out of trading.

Like us on Facebook at Compass Trading Association
And join our group for weekly trading info Compass Trading Association


Monday, 21 November 2016

Usain: Forex trading Brand Ambassador

Trading just got a speed boost from World-famous sprinter, Jamaican Usain Bolt. It may seem unlikely to associate the sprinter with Trading but read on and you will get the similarities.

Usain bolt continues to make his speed enlarge his circle of influence and thus gain even more popularity. Recently he he signed a deal with world-famous Forex broker XM trading. XM is now the official sponsor for Usain bolt making him their Official Brand Ambassador. XM boasts robust technology and speed for trading and Usain will depict such as their ambassador. This is unprecedented for the Lanky Jamaican sprinter who will retire soon from all internal sporting competitions.

It is unorthodox to associate Usain with Forex Trading, however, being a speed demon setting and breaking his own 100m and 200m Olympic and world championship records, Usain's demonstration of blistering speed is what XM represents. Speed is extremely critical in the trading arena in executing trade orders. Also it involves earnings and both XM and Usain will earn a huge amount from this deal.

Read the full story by clicking on the here or on the image below.